How To Calculate Z Score In Excel in 3 Steps!
In statistics, a z-score tells us how many standard deviations away a value is from the mean. We use the following formula to see how to calculate z score in excel.
Table of Contents
Learn How To Calculate Z Score In Excel
The formula to calculate z score in excel is:
z = (X – μ) / σ
Where in:
- X is a single raw data value
- μ is the mean of the dataset
- σ is the standard deviation of the dataset
Note: if you don’t know the population standard deviation, you should use a t-score instead of a z-score.
This tutorial specifically helps you calculate z-scores in Excel for raw data values. Suppose we have the following dataset (see image below), then we would like to find the z-score for every raw data value and we can perform the following steps to do so:
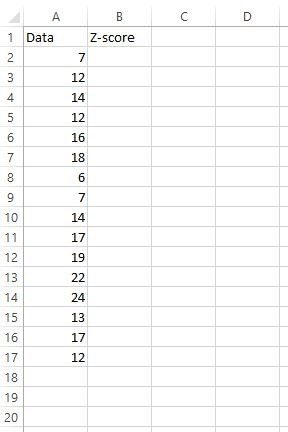
Step 1: Find the mean and standard deviation of the dataset.
First, we need to find the mean and the standard deviation of the dataset. The following formulas will show you how to do that:
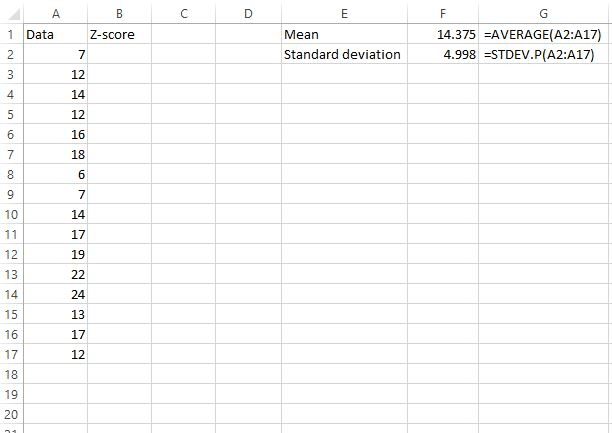
The mean is calculated at 14.375 and the standard deviation turns out to be 4.998.
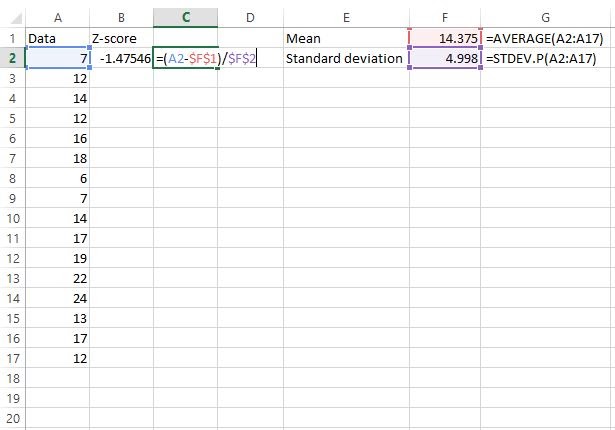
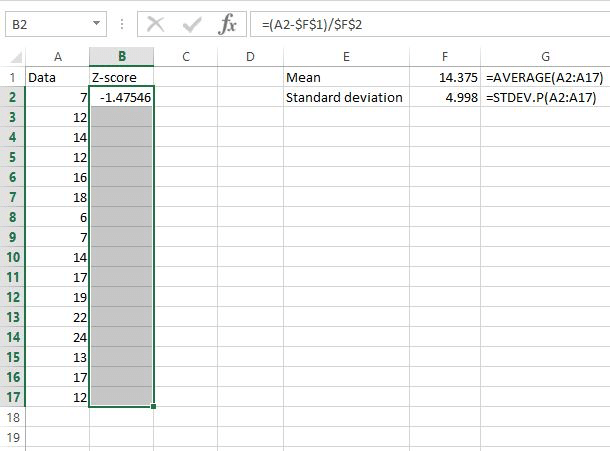
Step 2: Find the z-score for the first raw data value.
Next, we’ll find the z-score for the first raw data value using the formula z = (X – μ) / σ.
You can take a look at Cell C2 to see the formula we used to calculate the z-value in cell B2.
Step 3: Find the z-scores for all remaining values.
Now that we found the z-score for the first value in the dataset, we can simply copy the formula we used in cell B2 to the rest of the data values. In order to do this simply highlight the entire z-score column, starting with the first z-score we already calculated:
Next, press Ctrl+D. This copies the formula in the first cell to all of the cells below it.
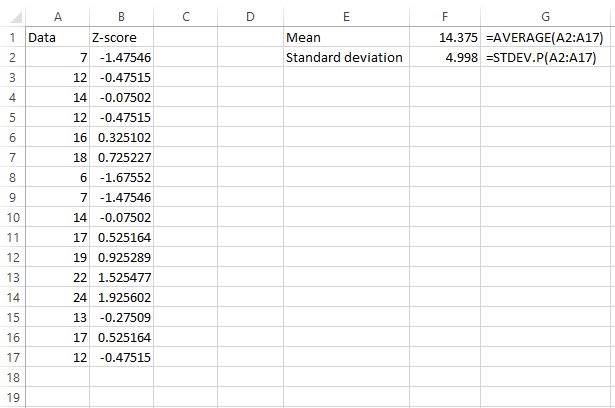
Now, we have found the z-score for every raw data value.
How to Interpret Z-Scores in Excel
Remember that a z-score simply tells us how many standard deviations away a value is from the mean.
A z-score can be positive, negative, or equal to zero and they all mean different things.
A positive z-score indicates that a particular value is larger than the mean, a negative z-score indicates that a particular value is less than the mean, and a z-score of zero indicates that the value is equal to the mean.
In our example, we found that the mean was 14.375 and the standard deviation was 4.998.
So, the first value in our dataset was 7, which had a z-score of (7-14.375) / 4.998 = -1.47546. This means that the value “7” is -1.47545 standard deviations below the mean.
The next value in our data, 12, had a z-score of (12-14.375) / 4.998 = -0.47515. This means that the value “12” is -0.47515 standard deviations below the mean.
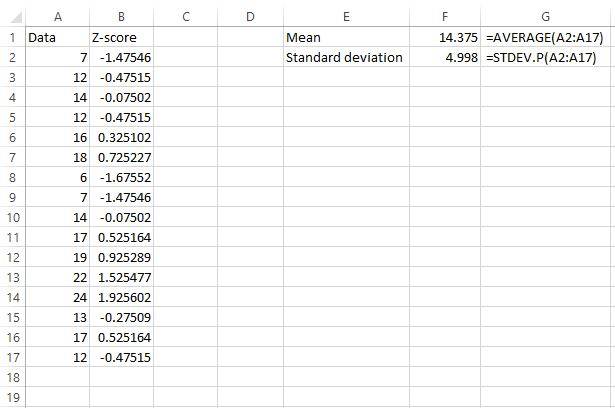
The further away a value is from the mean, the higher the absolute value of the z-score will be for that value.
For example, the value 7 is further away from the mean (14.375) compared to 12, which explains why 7 had a z-score with a larger absolute value.
After you’ve entered the formula once, you can use it over and over again. Just type a new mean, standard deviation and X value into the relevant boxes.